Output
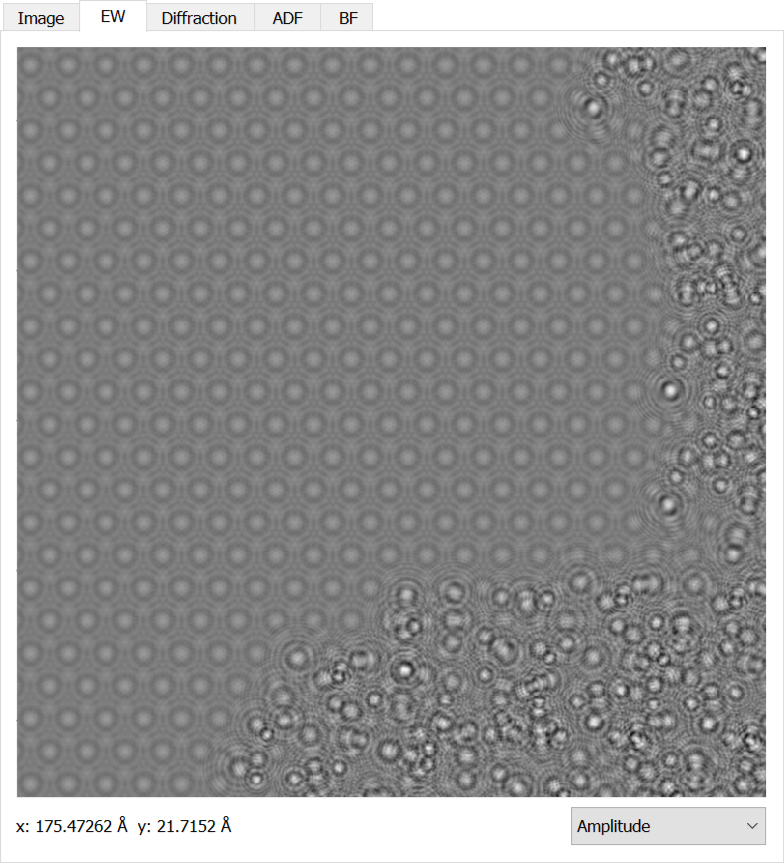
Figure The output panel.
Once you have performed a simulation, the output will be shown in the Output panel on the left side of the main interface. You may have to switch to the appropriate tab for the simulation you have performed. You can scroll to zoom, click and drag to move and right click to get a menu option to reset the image position. For the exit wave image, there is a combo box underneath to select how the complex image is displayed. Diffraction images are also shown on a log scale. It should also be noted that images will remain in the Output panel until a simulation is performed that will use the same panel.
To export the data, you can right click on the image and choose the Export sub-menu. Then you will have an option of RGB or Data. An RGB output is a more readable by most software, but most of the quantitative data has been lost. A Data image will save a TIFF file that uses 32-bit floating point numbers to store the data in its full format. These data images will not open in most software (it might try), instead you will need to open it in a program such as ImageJ and the Gatan Microscopy Suite.
Alongside the exported image, a .json configuration file will also be saved with the simulation parameters relevant to the exported image.